Seating Capacity
37,755 (night), 37,305 (day)
Largest Crowd
47,627 fans crowded well past capacity into Fenway Park for a doubleheader between the Red Sox and the New York Yankees on 22 September 1935, a figure accomplished well before more stringent fire laws and league rules set after World War II prohibited the overcrowding that was so common in the 1930s
Field Surface
Perennial Kentucky blue grass
Field Dimensions
Fenway Park measures 310 feet (94.5 meters) down the left field line: 379 feet (115.5 meters) in left center field; 390 feet (118.9 meters) in center field; 420 feet (128 meters) in deep center field; 380 feet (115.8 meters) in deep right field; and 302 feet (92 meters) down the right field line.
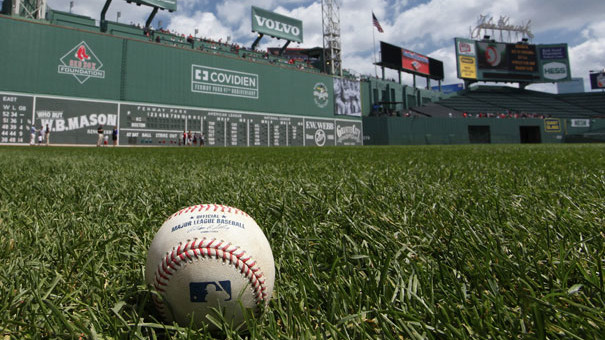
Outfield Wall Dimensions
The left field wall — also known as the Green Monster — measures 37 feet (11.3 meters) high. The center field wall is 17 feet (5.2 meters) high, the bullpen fences measure five feet (1.5 meters) and the right field fence is 3 to 5 feet (0.9 to 1.5 meters) high.
Attendance Figures (since 2004)
2019 Regular Season
Total Attendance: 2,924,627
Percent Capacity: 96.3%
Per-Game Average (81 Home Games): 36,106
2018 Regular Season
Total Attendance: 2,895,575
Percent Capacity: 95.3%
Per-Game Average (81 Home Games): 35,747
2017 Regular Season
Total Attendance: 2,917,678
Percent Capacity: 95.9%
Per-Game Average (81 Home Games): 36,020
2016 Regular Season
Total Attendance: 2,955,434
Percent Capacity: 97.2%
Per-Game Average (81 Home Games): 36,486
2015 Regular Season
Total Attendance: 2,880,694
Percent Capacity: 94.8%
Per-Game Average (81 Home Games): 35,564
2014 Regular Season
Total Attendance: 2,956,089
Percent Capacity: 98.5%
Per-Game Average (81 Home Games): 36,494
2013 Regular Season
Total Attendance: 2,833,333
Percent Capacity: 94.4%
Per-Game Average (81 Home Games): 34,979
2012 Regular Season
Total Attendance: 3,043,003
Percent Capacity: 101.4%
Per-Game Average (81 Home Games): 37,567
2011 Regular Season
Total Attendance: 3,054,001
Percent Capacity: 101.7%
Per-Game Average (81 Home Games): 37,703
2010 Regular Season
Total Attendance: 3,046,443
Percent Capacity: 100.9%
Per-Game Average (81 Home Games): 37,610
2009 Regular Season
Total Attendance: 3,062,699
Percent Capacity: 101.5%
Per-Game Average (81 Home Games): 37,811
2008 Regular Season
Total Attendance: 3,048,250
Percent Capacity: 104.0%
Per-Game Average (81 Home Games): 37,632
2007 Regular Season
Total Attendance: 2,971,025
Percent Capacity: 101.4%
Per-Game Average (81 Home Games): 36,679
2006 Regular Season
Total Attendance: 2,930,768
Percent Capacity: 100.0%
Per-Game Average (81 Home Games): 36,182
2005 Regular Season
Total Attendance: 2,847,888
Percent Capacity: 98.4%
Per-Game Average (81 Home Games): 35,159
2004 Regular Season
Total Attendance: 2,837,294
Percent Capacity: 100.7%
Per-Game Average (81 Home Games): 35,028
Source: MLB Attendance Report @ ESPN.com